Data on how Norwegians move around allow for a finetuned model of calculating the spread of coronavirus
But how accurate are these calculations, and what exactly can they be used for?
The COVID-19 pandemic has turned many of us into amateur epidemiologists, with a particular fascination with something called the reproduction number for the disease.
It seems like a lot depends on the value of this particular number.
If it stays below 1, that means that fewer and fewer people are being infected by the disease. If it climbs higher than 1, more and more people will be infected.
sciencenorway.no has had a chat with Solveig Engebretsen, one of the researchers in the modelling group at the Norwegian Institute of Public Health (NIPH). We wanted to try to understand how the mathematical models they use actually work.
And we also wanted to know how useful these kinds of models actually are — especially when there is still so much we don’t know about how the disease spreads.
The model in question is developed for Norway but isn’t necessarily conceptually different from models in other countries. However, as the mobile company Telenor has provided data on peoples movements across Norway’s municipalities – the Norwegian model is able to finetune its calculations that little bit extra, according to Birgitte Freiesleben De Blasio, Department director and head of the model group at NIPH.
Low mortality and a reproduction number below 1
Norway went into lockdown on March 12th, and started easing up on measure from April 20th, when for instance most kindergartens opened their doors, for limited hours and under strict measures to limit potential spread of the virus.
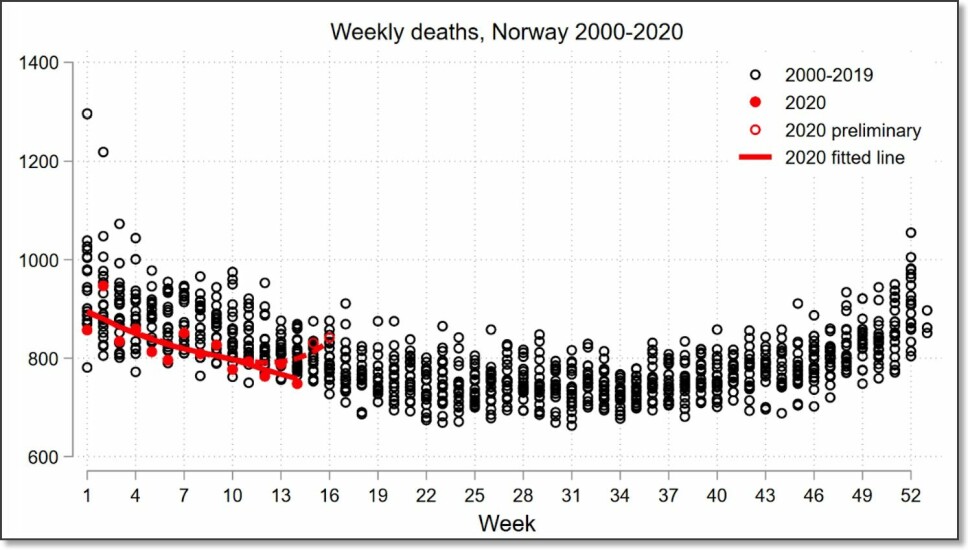
The mortality rate in Norway during the pandemic has been low. As per the publication of this article, 235 people have died from COVID-19, and the test capacity has been and continues to be high.
The official reproductive number is currently estimated to be 0,71 - however, in a recent report the Institute of Public Health say they believe it to be closer to 1, based on the number of new hospitalisaitons in May.

Mimics the spread of infection on the computer
Engebretsen says that the mathematical model they use does not calculate the reproduction number directly.
But the numbers the researchers get from the model can be plugged into a formula that gives infection numbers that have been regularly reported during the coronavirus pandemic.
“The reproduction number is the most popularly reported estimate, and is therefore what we choose to report ,” Engebretsen, who is employed at the Norwegian Computing Centre, a non-profit research institute that performs contract research.
But she points out that the most important thing about the mathematical model is not necessarily the reproduction number itself. Actually, the researchers' main goal is to create a good virtual simulation of how the infection spreads.
Because if the computer model can capture the essence of how the infection spreads, it can be used to look into the future.
“One of the important things we need to do is to estimate how many hospital admissions there will be and how many people will need a respirator,” Engebretsen says.
Moves virtual Norwegians every six hours
So how does this mathematical model actually work?
Simply stated, it lets the infection run its course in the population — virtually, on the computer.
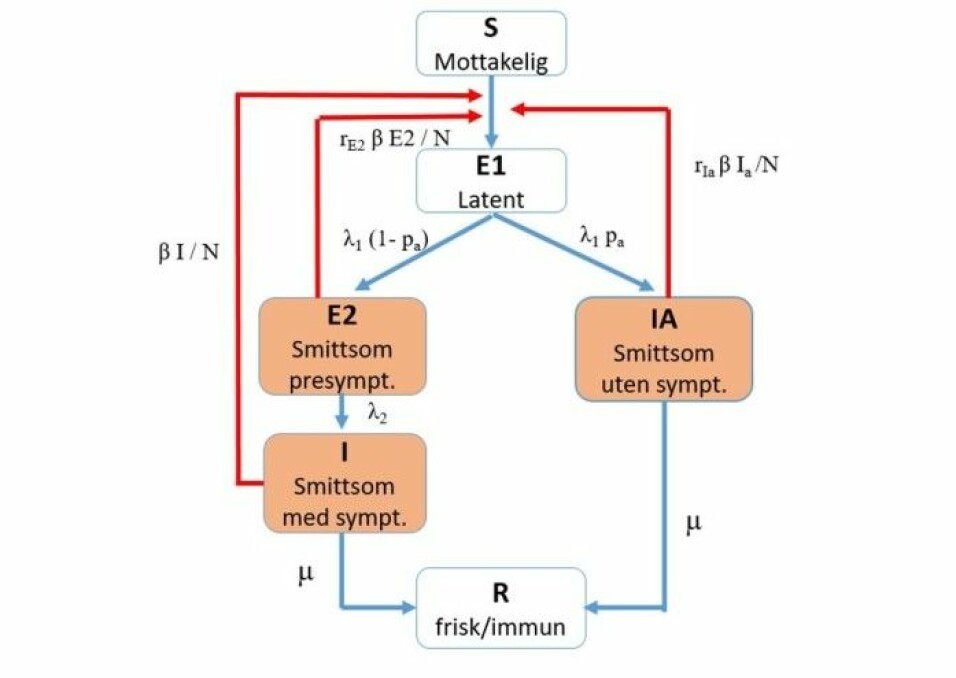
Within each municipality, inhabitants are assigned to one of six infection categories. People in three of the six categories are considered infectious.
The researchers distinguish between those who have COVID-19 with symptoms and those who contract the disease but have no symptoms. This is because people who have COVID-19 with symptoms are likely to spread the disease more easily than when people are infected but have no symptoms.
For each municipality, the researchers have created a mathematical model that looks like this:

Don’t worry about all the symbols, but pay special attention to the red arrows.
The researchers try to figure out how often the infection spreads along these arrows. They want to know how easily people who are in the three infectious categories (orange boxes) can infect healthy people who are susceptible to infection.
You might also notice the symbol β (beta) along the red arrows. We’ll come back to that.
Mobile data from Telenor
In January, before the epidemic started, all inhabitants in each municipality were in the susceptible category.
When people with the virus started returning to Norway from abroad, researchers put them in one of the infection-carrying categories (highlighted in orange in the figure) for the municipalities to which they travelled.
The researchers then let the infection play out in their virtual municipalities so they could see what happened.
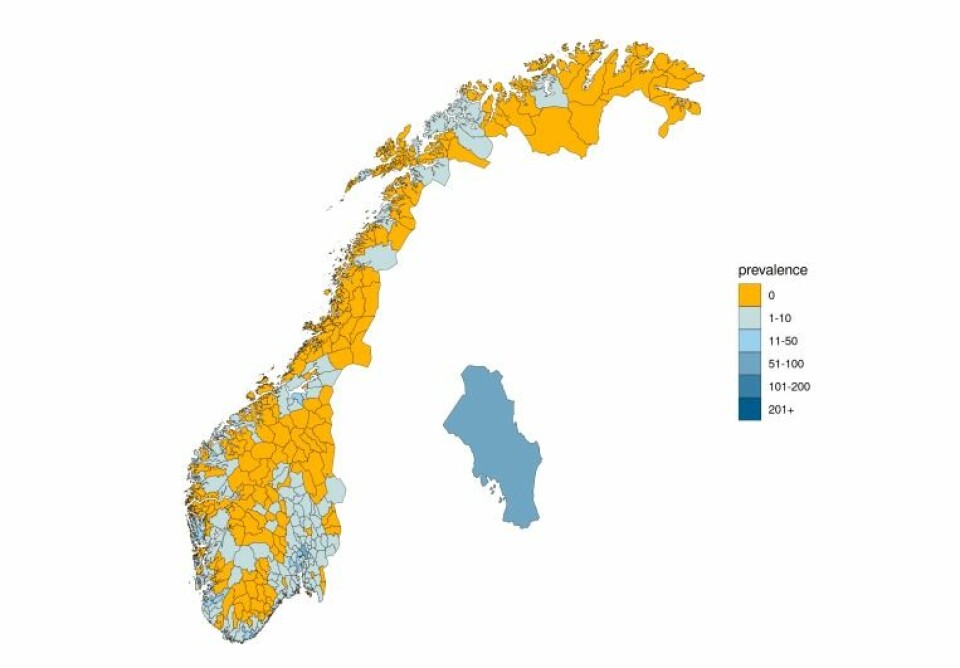
The researchers update the model every six hours with data from Telenor about how many Norwegians are moving from one municipality to another.
This means that fictional people in the model may be moved from the Oslo model to the Trondheim model, for example. If the Oslo citizen who moves to Trondheim is infected, then the new infected person is included the Trondheim model, which can cause the infection rate to increase there.
Many assumptions
So how does all this relate to the reproduction number?
The formula for this number is a combination of what happens along the arrows in the figure as they leave the different orange boxes, says Engebretsen.
Thus, it includes how many people are typically infected in the three different infectious categories: before you get symptoms, when you have symptoms, or if you have the disease without any symptoms at all.
Here’s where the value β (beta) comes into the picture. This number tells researchers something about how infectious the disease is and how much contact people have with each other in the population.
“It's really the beta we estimate. Then we use that estimate to calculate the reproduction number for the model,” says Engebretsen.
Each simulation starts anew
All the other symbols along the arrows in the figure are numbers that the researchers derive from both Norwegian and international research on the coronavirus.
For example, these numbers describe how many days people should be kept in each infection category. Or what percentage of people who are infected are asymptomatic. The researchers update these numbers as new information about the virus becomes available.
But since the researchers do not know for certain what all the numbers in the figure actually are — and how the course of the disease varies from person to person — the researchers have introduced some randomness into the model.
That's why they do many different simulations of how the infection is spreading in Norway, which gives them slightly different results each time.
For each new simulation, researchers start at the beginning from 1 January 2020. And then they see what happens to the infection in the population.

Uncertainties in the calculations
But with so many uncertain numbers and so many assumptions, can we really rely on this kind of model for the coronavirus?
“Nationally I would say we have pretty good estimates,” says Engebretsen.
She points to the results from the mathematical model itself, because when the researchers use the models to predict how many people will end up in the hospital, the predictions are in good agreement with reality. This indicates that the model can capture the most important information, Engebretsen says.
At the same time, she thinks it is a little misleading to focus on an exact infection number R, and that the focus instead should be on confidence intervals.
Calculations from the model show that the reproductive number R could be as low as 0.29 or as high as 0.92, according to the estimate in the report from the Norwegian Institute of Public Health on May 16.
“We try to emphasize that you have to consider the whole interval for the estimated reproduction number. The mean is not very interesting in itself when there is so much uncertainty ,” says Engebretsen.
Don’t want to overadjust model to real numbers
The researchers also use information on how many people with COVID-19 actually end up in the hospital in the real world to adjust their mathematical contagion model. They use this to calculate transmissibility — which is beta.
But Engebretsen emphasizes that they don’t want the model to follow the data too closely.
Adapting a model too much with actual data can be like interpreting a record cold May here in Norway as if the country is headed into a new ice age.
In order to obtain a robust transmission model that can predict the burden on the healthcare system in the future, it is important not to overfit the model to the hospital admissions, says Engebretsen
"We aim for a model that follows the hospital admissions well, without overfitting the data. Otherwise we risk obtaining a model which fits the data we have observed up until now very well, but that does not generalize well to new data,"says Engebretsen.
Transmissibility held constant
This is one reason why the researchers at the NIPH model group have chosen not to allow transmissibility to vary from day to day.
On the other hand, they are using three different numbers for transmissibility for each day.
The first infection number is from when the epidemic started until strict lockdown measures were implemented. The second number covers the span from then until Norway began to reopen. The third infection number is from after the country began to open up again.
In the model itself, it is actually the beta (transmissibility) that is held constant in this way.
University researchers critical
The fact that the NIPH group has held transmissibility constant has been criticized in an article in the national newspaper VG by Dag Svanæs, a researcher at the Norwegian University of Science and Technology (NTNU).
The numbers reported by the Institute of Public Health say very little about how the pandemic is spreading in the population right now, Svanæs says.
And two researchers at UiT — the Arctic University of Norway, have themselves calculated that the reproduction number, is over 1, as they wrote in a research paper.
These researchers believe that transmissibility should be allowed to vary more freely in the model.
Engebretsen agrees that holding the number for transmissibility, or the beta number, constant is a simplification.
But she also emphasizes that all models are simplifications because they are based on different assumptions about reality.
“You might say that our model is too simple because we assume constant values between dates, but it fits well with the curve of hospital admissions,” she said.
As long as the model is a good description of what is actually happening, she believes that the fact that the model is simple is a strength. And that a more flexible model will not necessarily give more correct answers.
Only Norway uses this model
So why is there no set way to calculate a number for transmissibility?
The leader of the model group at the Institute of Public Health, Birgitte Freiesleben de Blasio, gave a talk at the Norwegian Academy of Science and Letters on April 23. At that time she was asked if there are any other countries that use this particular model to calculate how the infection spreads.
“The model has been developed for Norway, and we are the only ones who use this model. But we meet regularly with the modelling groups from the Public Health Institutes in the other Nordic countries,” de Blasio said.
She also said that of the Nordic countries, the Norwegian model is the most similar to the one being used in Denmark.
De Blasio also says that the modelling group at the Institute of Public Health is working on several different models. Among other things, they have another model they adjust according to how many people get the virus as detected by laboratory tests.
"The Institute of Public Health makes an overall assessment of the situation based on results from modelling and many types of data, including consultations with GPs, laboratory data, deaths, monitoring in hospitals and nursing homes, and cross-sectional studies of the population," de Blasio said.
Translated by Nancy Bazilchuk
———


