Annonse
CO2 map provides quality control for climate research
A new atlas depicts the actual amounts of CO2 in the surface water of all the oceans. It will be used to control climate models and aims to make IPCC reports more reliable.
Denne artikkelen er over ti år gammel og kan inneholde utdatert informasjon.
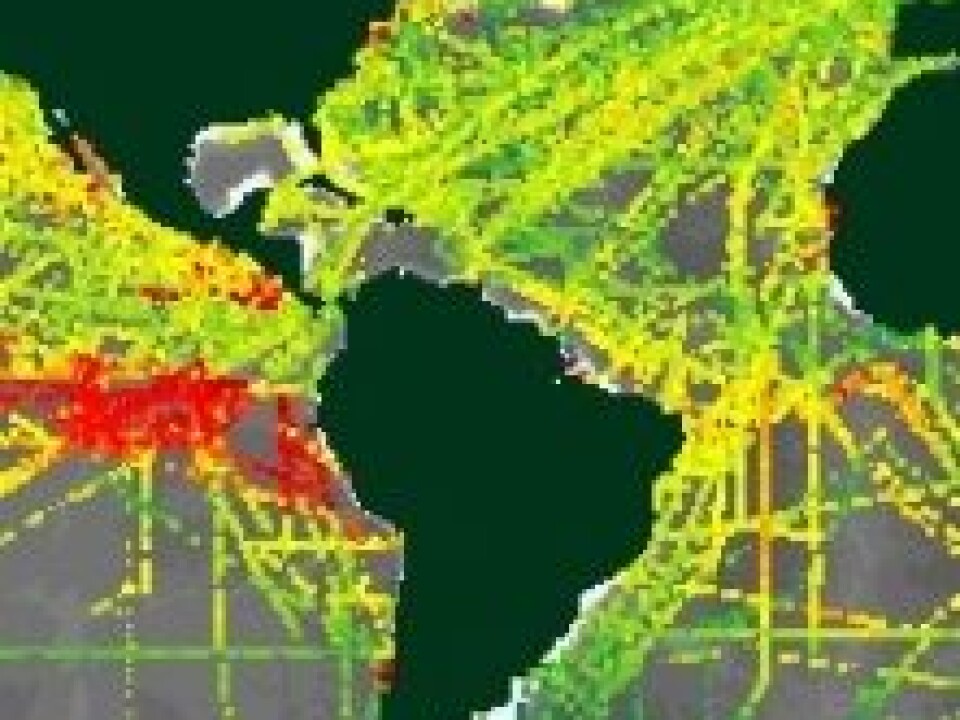
The atlas is called SOCAT – or The Surface Ocean CO2 Atlas.
It provides an overview of CO2 quantities in surface water of the world’s oceans.
Scientists at the Institute of Marine Research, the Bjerknes Centre for Climate Research and the University of Bergen have led international initiatives and work with the atlas, which will be presented this month to the American Geophysical Union (AGU).
“Now that we’ve gathered all this data in one place we can help ensure the verifiability and credibility of climate research,” says Are Olsen, a researcher at the Institute of Marine Research in Bergen and one of the key participants in the project.
He is now encouraging researchers across the globe to send in their data to fill in the blanks on the atlas.
Annonse
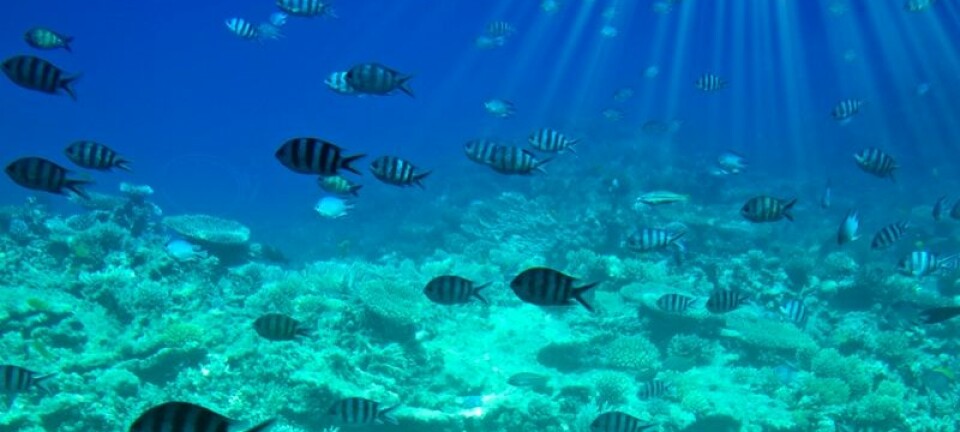
The seas contain CO2, but how much?
Obviously, CO2 is in the air everywhere, but it can also be stored in the oceans.
Roughly estimated, the seas — more specifically the top couple of metres of seawater — absorb some 25 percent of all the CO2 currently emitted in the world.
“Thus the oceans help keep the greenhouse effect at bay to a certain extent, because less CO2 ends up in the atmosphere. But the sea’s CO2 storage capabilities can change,” explains Olsen.
If the oceans heat up, their ability to store carbon dioxide decreases. It’s akin to the way a glass of soda turns flat faster in a warm room than in a refrigerator.
The temperature of seawater is also influenced by the greenhouse effect, and in a system where everything is interrelated, it’s no surprise that entirely reliable knowledge of causes and effects is hard to pin down.
First we need measurements of what is actually happening around the planet.
Controlling IPCC reports
For example, the Global Carbon Project is a project in which scientists calculate carbon budgets for the entire world. It’s a total overview of how much carbon is being emitted in comparison to how much is being stored on land and on sea.
"The project currently includes data from the oceans, but this is only the result of models," explains Olsen.
This means the numbers are based on theories about what the scientists think will happen, rather than measurements of what is actually happening.
“Our data can be used to test the validity of the carbon budgeting models,” says Olsen.
He explains that the carbon budgets are essential to the Intergovernmental Panel on Climate Change (IPCC) reports.
"So we hope SOCAT will be actively used to make the reports as accurate as possible,” says Olsen.
Annonse
Infrared light reveals amounts of CO2
SOCAT is an international collaboration with participants from the US, Australia, Japan, Norway and other countries.
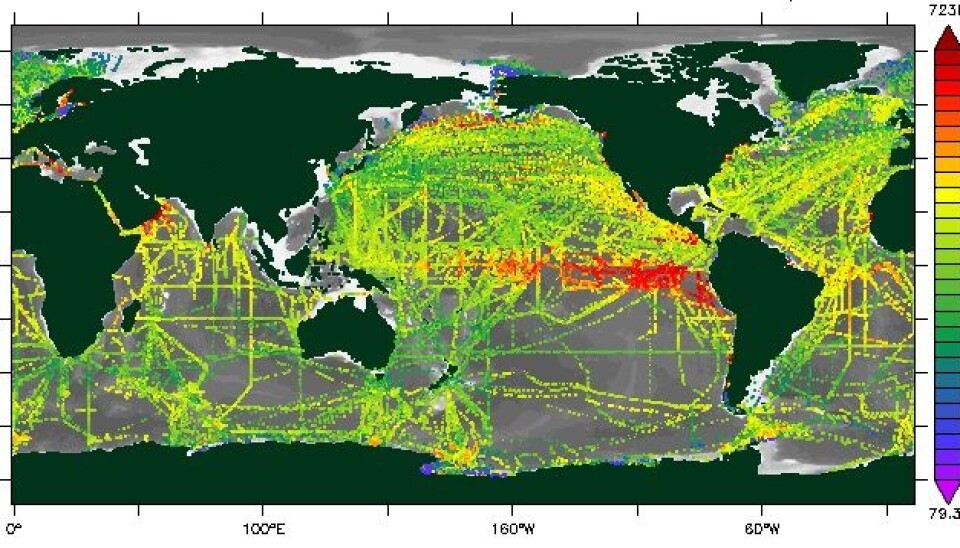
The data is collected in an atlas based on samples taken by cargo ships and research vessels navigating around the globe.
Merchant marine vessels help in the research by being equipped with advanced monitoring stations that can measure CO2 quantities in seawater.
In simple terms, they shine infrared light through the seawater and register how much infrared light comes out on the other side.
CO2 absorbs infrared light and this property can be used to calculate how much CO2 is present in the water.
Naturally, the atlas is most complete in areas that are most frequented by maritime traffic. Therefore the North Atlantic and the Pacific around the equator are the best covered areas.
Short time series
We know less about other parts of the oceans, for instance west of Australia and in parts of the sea around Antarctica.
The earliest measurements registered by SOCAT are from around 1968. However, Olsen says 80-90 percent of the measurements were made after 2000.
He says this is a short period in a climate perspective, and they know very little about how this will vary as time passes.
“But I was involved in a study a few years ago which showed the sea’s capabilities for storing CO2 are more variable than we thought, and changes don’t take much time," he says.
“We can’t quite account for this, so it’s vital that we also study the oceans’ CO2 storage capabilities during shorter increments of time.”
Politicians need the atlas
The atlas has already been accessible to researchers around the world for about three years and has been received enthusiastically by not only the scientists involved in the project.
Leif G. Andersson, a professor in marine chemistry at the University of Gothenburg in Sweden, thinks it’s great that such large-scale measurements in this field have finally been compiled and made available to scientists all over the world.
“But the marine contingent of this network isn’t as well developed as the land-based share. And 70 percent of the surface of the planet is covered by sea,” he says.
He also points out that politicians want to be given a basis for calculating future CO2 concentrations and regional distribution of CO2, particularly linked to regional emissions.
They need overviews like this to give them that basis. Without this information it is certainly harder to make political decisions based on solid scientific evidence, according to Andersson.
Send in your measurements
Plans are being made to fill in more and more of the blanks in the SOCAT map.
“We hope to obtain a routine comparison of data, so we can issue new versions of the atlas every other year, or even annually. This will make it a resource for climate researchers round the world,” says Olsen.
He and his collegues are now asking researchers who have data on the CO2 levels in various ocean areas to please send their measurements.
----------------------------------------------
Read this article in Norwegian at forskning.no
Translated by: Glenn Ostling


