Oceans are at their deepest in 250 million years
And they have hardly been deeper in the last 400 million years than now.
“It moves absurdly slowly,” says Krister Karlsen. He is a PhD candidate in Geophysics at the University of Oslo (UiO)’s Centre for Earth Evolution and Dynamics.
Karlsen is talking about how the Earth’s tectonic plates move – ever so slowly but surely, every single year. From a human perspective, this happens so slowly that it is almost imperceptible.
But over the course of a hundred million years, the world map changes dramatically.
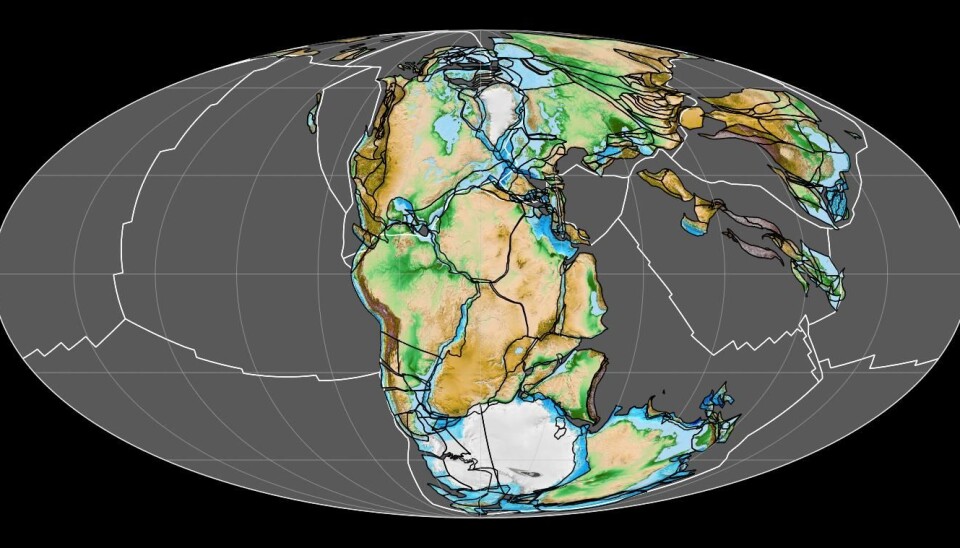
The world map 200 million years ago shows all the continents assembled in the supercontinent of Pangaea, a time when dinosaurs were well on their way to dominating the Earth’s landmasses.
Since then, the continents have been shifting farther and farther apart, and now they may be as far apart as they can be, says Karlsen. Give the Earth a few hundred million years more, and the continents will probably remerge into a new supercontinent. One proposed name for that possible future reunion is Pangaea Proxima, according to New Scientist.
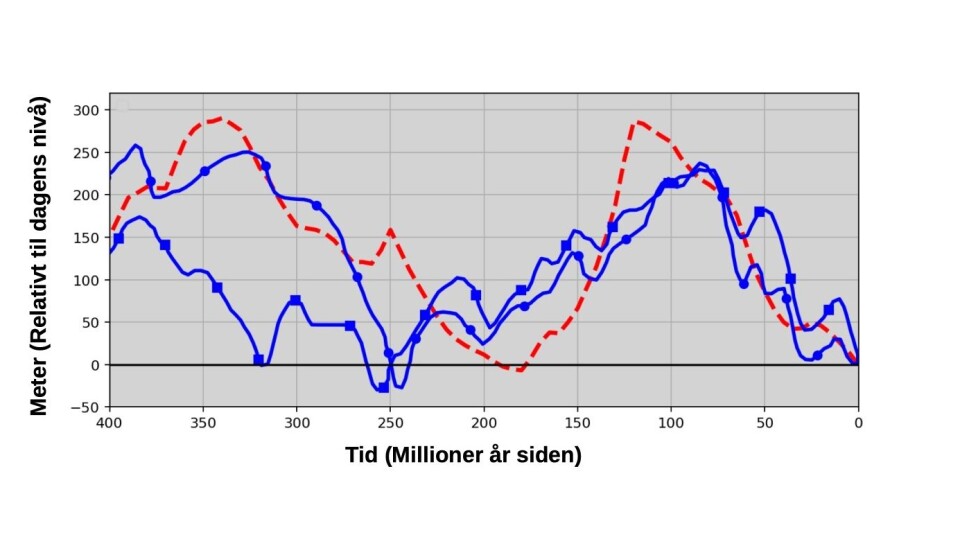
The movements and age of tectonic plates have a great effect on the depth of the world’s oceans. Just over 100 million years ago, the oceans were around 250 metres shallower on average than they are today.
The older the seabed, the deeper it is, according to a new research article by Karlsen and several colleagues at the Centre for Earth's Evolution and Dynamics.
“And right now we have a very old seabed,” says Karlsen.

Downward pressure
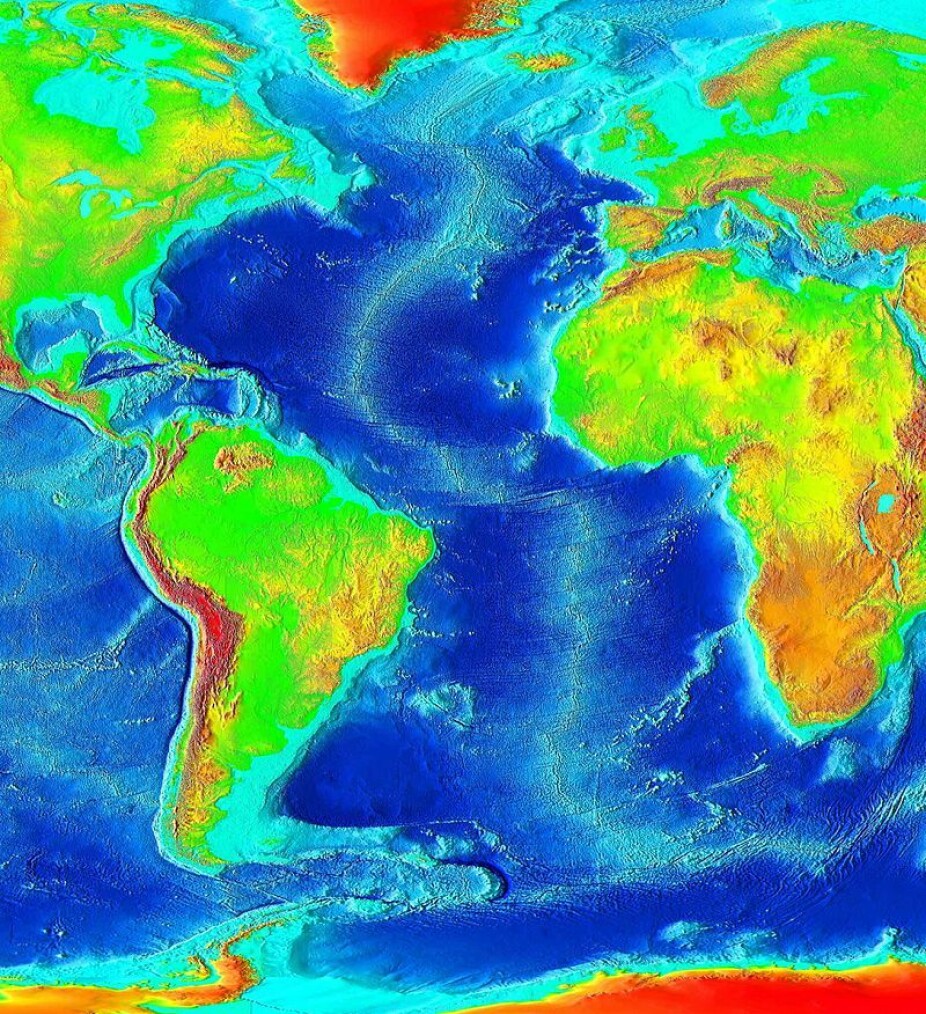
New seafloor is constantly being formed by lava rising up through fractures from the Earth’s interior and solidifying as the plates move apart, for example along the mid-Atlantic ridge.
Elsewhere, the old seabed disappears below other plates and is recycled beneath the surface. These places are called subduction zones.
“When the lava rises and cools, the mass density rises, resulting in the seafloor becoming heavier as it gets older,” says Karlsen.
This older and heavier seabed exerts downward pressure on the masses below, and the entire seafloor slowly descends. In this way older seabeds lead to deeper seas on average, while younger seabeds are shallower.
As the plates slowly move, the seabed gets older and older before being recycled, and now the plates are moving incredibly slowly, even for tectonic plates.
Karlsen says the seafloor has never been older than it is now, as far as scientists know. It’s average age is about 63 million years.
The oldest parts of the seabed are approximately 200 million years old.

A similar process happened in Scandinavia during the last ice age 10 000 years ago, where the weight of kilometre-thick glaciers pressed the land masses down. Since the ice disappeared, the country has rebounded several hundred metres, and Norway’s uplift is still a few millimetres a year, according to the Norwegian Mapping Authority.
400 million years
Karlsen has helped create an algorithm that models the age of the seabed over the last 400 million years.
The algorithm is based on models of how the tectonic plates have moved during the same time period, and the research has been published in the journal Computers and Geoscience.
The researchers have also compared the results with other research results estimating how the sea level has changed over several hundred million years.
This research is based on geological traces of the seafloor and marine environment from different areas of the world. These can be fossils of marine animals far above today's sea level or geological layers that are only deposited where oceans are also found, such as the beach.
The Earth’s landmasses also change dramatically on these time scales, and some mountains used to be part of the seafloor. The Himalayan mountain range was formerly a seabed, until it was pushed up by the Indian continent about 47 million years ago, according to this 2015 study.
Karlsen says that their model fits quite well with earlier estimates of how the sea level has changed, which can be seen in the picture below.
“But after about 250 million years, big uncertainties are cropping up,” he says.
Karlsen believes these estimates and models will gradually get better and better.

Supercontinent cycles?
As the chart shows, the seabed may have reached a peak just over 100 million years ago, and a new peak just under 350 million years ago.
This could hint at a supercontinent cycle on earth, which is directly related to how the continents separate and rejoin over hundreds of millions of years.
This cycle may have repeated itself for billions of years. Before Pangaea, there was the supercontinent Rodinia about a billion years ago, according to this 2012 Nature study.
Earlier yet, the supercontinent Nuna might have existed more than 1.5 billion years ago.
But whether this cycle is related to a sea level supercycle remains uncertain.
“It's hard to say anything about the regularity of such a possible cycle,” says Karlsen.
The human genus has been around for a few million years, and our species, Homo sapiens, has been here for about 300 000 years.
From a human perspective, the continental plates have changed very little since the origin of our species on Earth, and we have settled along the coast in much of the world.
Although the coast is constantly changing due to the movements of the tectonic plates, climate change is also contributing to changing sea levels. According to the US National Oceanic and Atmospheric Administration (NOAA), the ocean rose by an average of 3.6 millimetres between 2006 and 2015.
This sea level rise is driven by completely different processes than those which occur due to tectonic plate movement. The ocean is expanding as it gets warmer, and meltwater from ice and snow contributes to the increase, according to NOAA.
In just over 100 million years, the sea level has changed by about 250 metres – or an average of 0.0025 millimetres per year – due to the movement of the tectonic plates, according to these new models. Karlsen points out that this is far slower than the sea level rise going on today.
Translated by: Ingrid P. Nuse
Reference:
Karlsen et al: A tracer-based algorithm for automatic generation of seafloor age grids from plate tectonic reconstructions. Computers & Geoscience, 2020. DOI: 10.1016 / j.cageo.2020.104508.
———
Read the Norwegian version of this article on forskning.no


