Research on data visualization
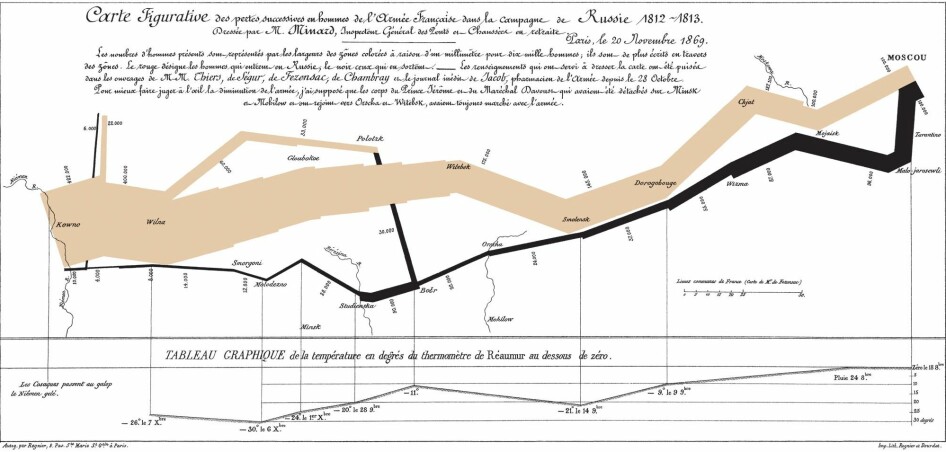
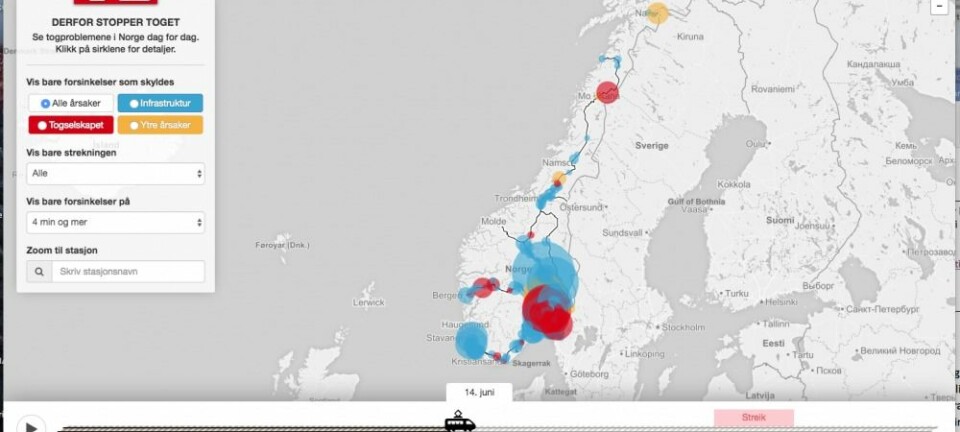
Graphs, charts and colorful maps. We meet them almost every day, in the news media, in the textbooks and in the information campaigns. The amount of data in society is rapidly growing and it is becoming easier to visualize them.
How do we read such data visualizations? And how are they made? Do they make the news and the textbooks more objective and informative, or are they perceived more or less as decorations?
In this blog, nine researchers in a project administered from the University of Agder, Norway, ask how we better can understand and critically evaluate data visualizations, those of us who are neither mathematicians nor designers.
To learn more about the project, please visit our website, indvil.org.