
Annonse
Animal populations saw average declines of 69 per cent, but what does that actually mean?
The figure from the new WWF report can easily be misinterpreted.
Published
The World Wildlife Fund (WWF) released a terrifying report on the world’s wildlife recently.
Between 1970 and 2018, monitored animal populations have decreased by an average of 69 per cent, according to the 2022 Living Planet Report.
It is a grim figure that indicates a dire situation for many animal populations around the world.
However, as Hannah Ritchie writes in the scientific online publication Our World in Data, it can be easy to misinterpret the numbers. The figure has been reported imprecisely in the media several times.
32 000 animal populations monitored
Annonse
The Living Planet Index collects data on vertebrate populations.
A population is comprised of individuals of an animal species that live within a geographical area, for example wild reindeer on Norway’s Hardanger Plateau.
The index is based on studies and monitoring reports from 32 000 populations of approximately 5200 species.
The index looks at the 32 000 populations and by what percentage they increased or decreased. Then the percentages are added together and their average calculated.
So on average, populations have shrunk by 69 per cent since 1970.
However, that does not necessarily mean that over two-thirds of the world's wildlife are gone.
The number does not tell us how many individuals are gone or how many populations are shrinking.

Not the number of individuals
Our World in Data illustrates this with an example.
The black rhino is a critically endangered species of rhinoceros in Africa. Two of these populations live in Tanzania and Botswana.
The population in Tanzania has plummeted from approximately 3800 animals in 1980 to just 160 animals in 2017. There are now 96 per cent fewer rhinos there.
In Botswana, the situation has improved over the same period but from a very poor starting point. The population there has increased from 30 rhinos to 50, an increase of 67 per cent.
If we combine the development of both populations, as is done in the Living Planet Index, then we find that these rhinoceros populations have experienced an average decline of 15 per cent.
But this number does not tell us how many individuals have been lost. Overall, 95 per cent of the rhinos actually disappeared.
Annonse
Another example
Other times the numbers go the opposite way. An addendum to the WWF report provides another example, which is also described by The New York Times.
Let's say a group of birds drops from 25 to five individuals. That is a decrease of 80 per cent.
A bear population goes from 50 to 45, a drop of 10 per cent.
A group of sharks numbered 20 but dropped to 8, 60 per cent fewer in number.
The average decrease in this case is 50 per cent.
But the number of individuals has declined from 95 to 58, or only 39 per cent.
Several ways to calculate
“The overall percentage doesn’t necessarily tell us anything about the total number of individuals that have disappeared,” confirms Sverre Lundemo, senior advisor for biodiversity at WWF.
The index weights all the populations equally.
That is one of several ways to do it, says Lundemo. But the method used in the report might give you a better picture of the population development, he says.
Often, large populations do not decline as much as the small ones.
“However, the numbers do show that the population base as a whole is slowly but surely being eroded,” says Lundemo.
“The smallest populations are the most vulnerable, and they disappear first. Then perhaps larger populations will be split up and slowly but surely erode away.
The index thus tells us something about the state of the world's animal populations. And the situation is very serious, says Lundemo.
“The index clearly shows that we are in an ecological crisis, where our over-consumption of natural resources has incurred, and still entails, a great cost to the natural diversity of our planet. It shows how we are weakening our own life foundations, which will ultimately impact us."
Half of species decreasing in number
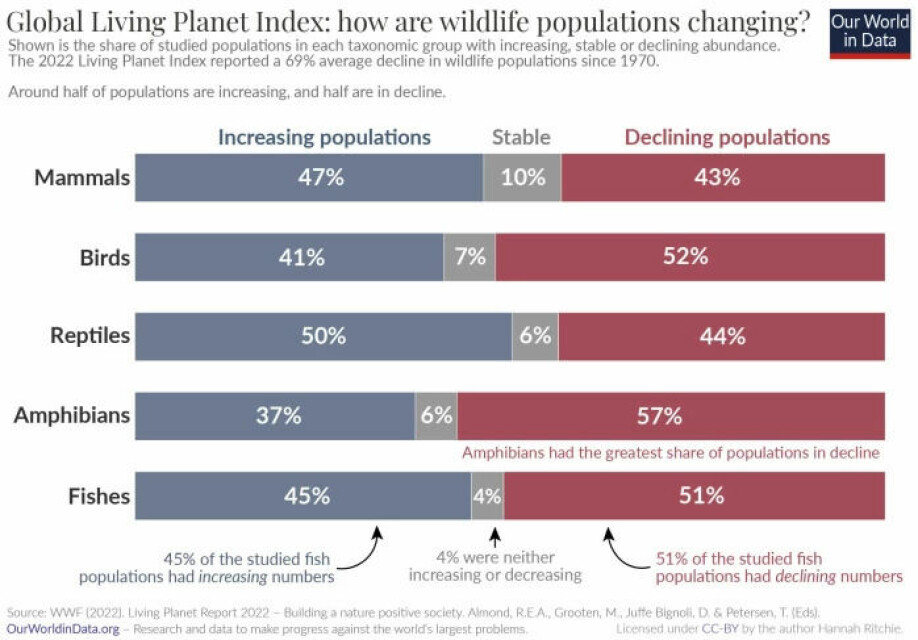
Around half of the species of mammals, birds and reptiles included in the report show a downward trend. About half of the species are stable or increasing in number.
Fish and amphibian numbers indicate that somewhat more species are in decline than are increasing.
Roughly speaking, about as many species are trending negative as ones that are increasing.
However, when populations have averaged a 69 per cent decline, it means that the extent of population loss is greater than their growth.
Many animals threatened with extinction
Lundemo thinks it is very clear that overall wildlife numbers have gone down in the last 50 years.
He mentions other sources that point to the same thing. A report from the Nature Panel in 2019 estimated that one million species are at risk of extinction. Insects and plants were also included.
Wildlife now has more limited habitat. Humans have significantly altered 75 per cent of the Earth’s land surface, and over a third of ice-free land comprises pasture or fields, according to the report.
The international red list shows that 41 per cent of amphibians and 27 per cent of mammals are threatened with extinction.
Humans and livestock make up 96 per cent of the biomass of all mammals. Wild mammals make up only four per cent.
“These are just other ways of seeing how nature is being destroyed,” says Lundemo.
What happens if you remove extremes?
Researchers have questioned whether the Living Planet Index is sensitive to extremes.
In a 2020 study in Nature, researchers found that by removing 2.4 per cent of the populations that had the strongest decline, the negative trend was turned into a slightly positive one. But the study has been criticized by other researchers.
The new Living Planet index has been stress-tested by removing up to ten per cent of the populations that both decrease and increase the most, according to Our World in Data. In all cases, the index still shows a strong decline.
New data added this year
The figures that the index data is based on come from various sources, says Lundemo.
“They come from surveys in the field, from scientific publications, authority reports and other reports that deal with monitoring various populations,” he says.
“The scientists who compile the data thoroughly assess the data quality, test the values through modelling and ensure that the time series is long enough to include it in the index.”
Examples of surveys that are used are counts of individuals, counts of nests or the number of fish caught during a certain time in a research context. Read more about them on the Living Planet Index website.
The report is published every two years, and more material is added each time.
“This year, one of the big differences is that scientists have started to include data that has been published in other languages, such as Portuguese and Spanish. This has meant that we have much more data from the Amazon,” Lundemo says.
Since the previous report in 2020, 838 new species and 11 000 new populations have been added.
Big changes in Europe’s natural world already before 1970
The most alarming decline in is taking place in Latin America. The populations here have seen an average decline of 94 per cent.
“In the last 50 years, population numbers have gone down a lot, especially in Latin America. Data history is limited, so 1970 has been chosen as the starting year to proceed from,” says Lundemo.
“As far as Europe is concerned, a lot of natural resources were destroyed or degraded before 1970. So we don’t see as much of a decline in Europe as we do in Latin America,” he says.
The landscape has undergone major changes in Latin America since 1970, says Lundemo.
“A lot of the deforestation to produce meat, soy and other crops has occurred since 1970. Similarly, a great deal of the deforestation to make room for palm trees in Indonesia and Southeast Asia has occurred since 1970.”
“The index in this way shows the major shifts in the extensive use and destruction of nature,” he says.
———
Read the Norwegian version of this article at forskning.no